Visualizations for Nerd Parents
Alexander Alber · Interactive tools · 2026 · in German
A set of interactive visualizations, calculators and helpers for analytically minded parents, around the topic of pregnancy and early childhood. The tools are in english and german. The underlying models are mostly original work, but based on publicly available clinical data.
These are personal hobby projects - non-commercial, not extensively tested, and provided without any warranty. Feel free to use them, at your own risk.
Parental Leave Planner
Interactive planner for German parental leave benefit ("Elterngeld") strategies
A month-by-month grid covering 24 life months, letting both parents independently assign Basis, Plus, or Partnerschaftsbonus months by clicking cells. Calculates total payout and more.
Open tool →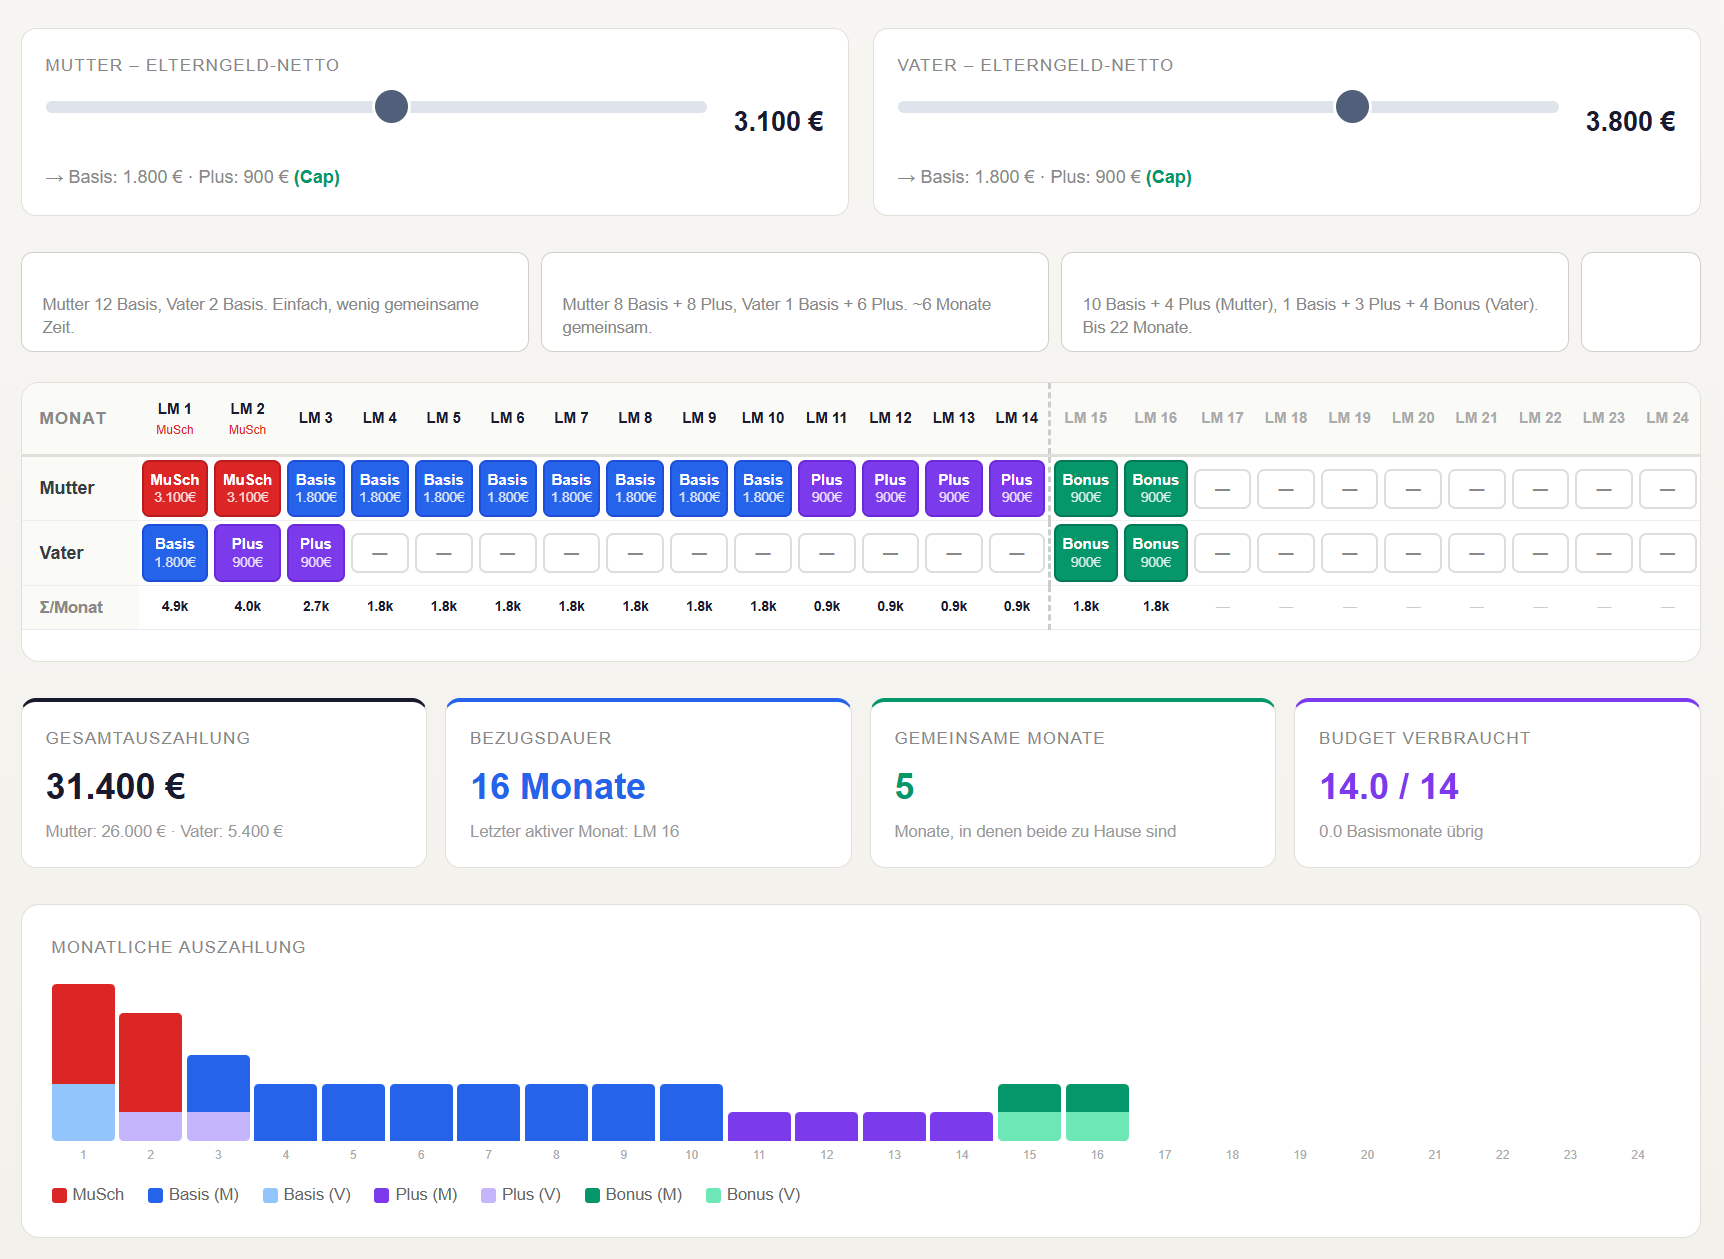
Pregnancy Timeline
Symptom timeline across pregnancy weeks
Maps pregnancy symptoms over pregnancy weeks. Also risk curves for miscarriage probability and premature birth survival.
Open tool →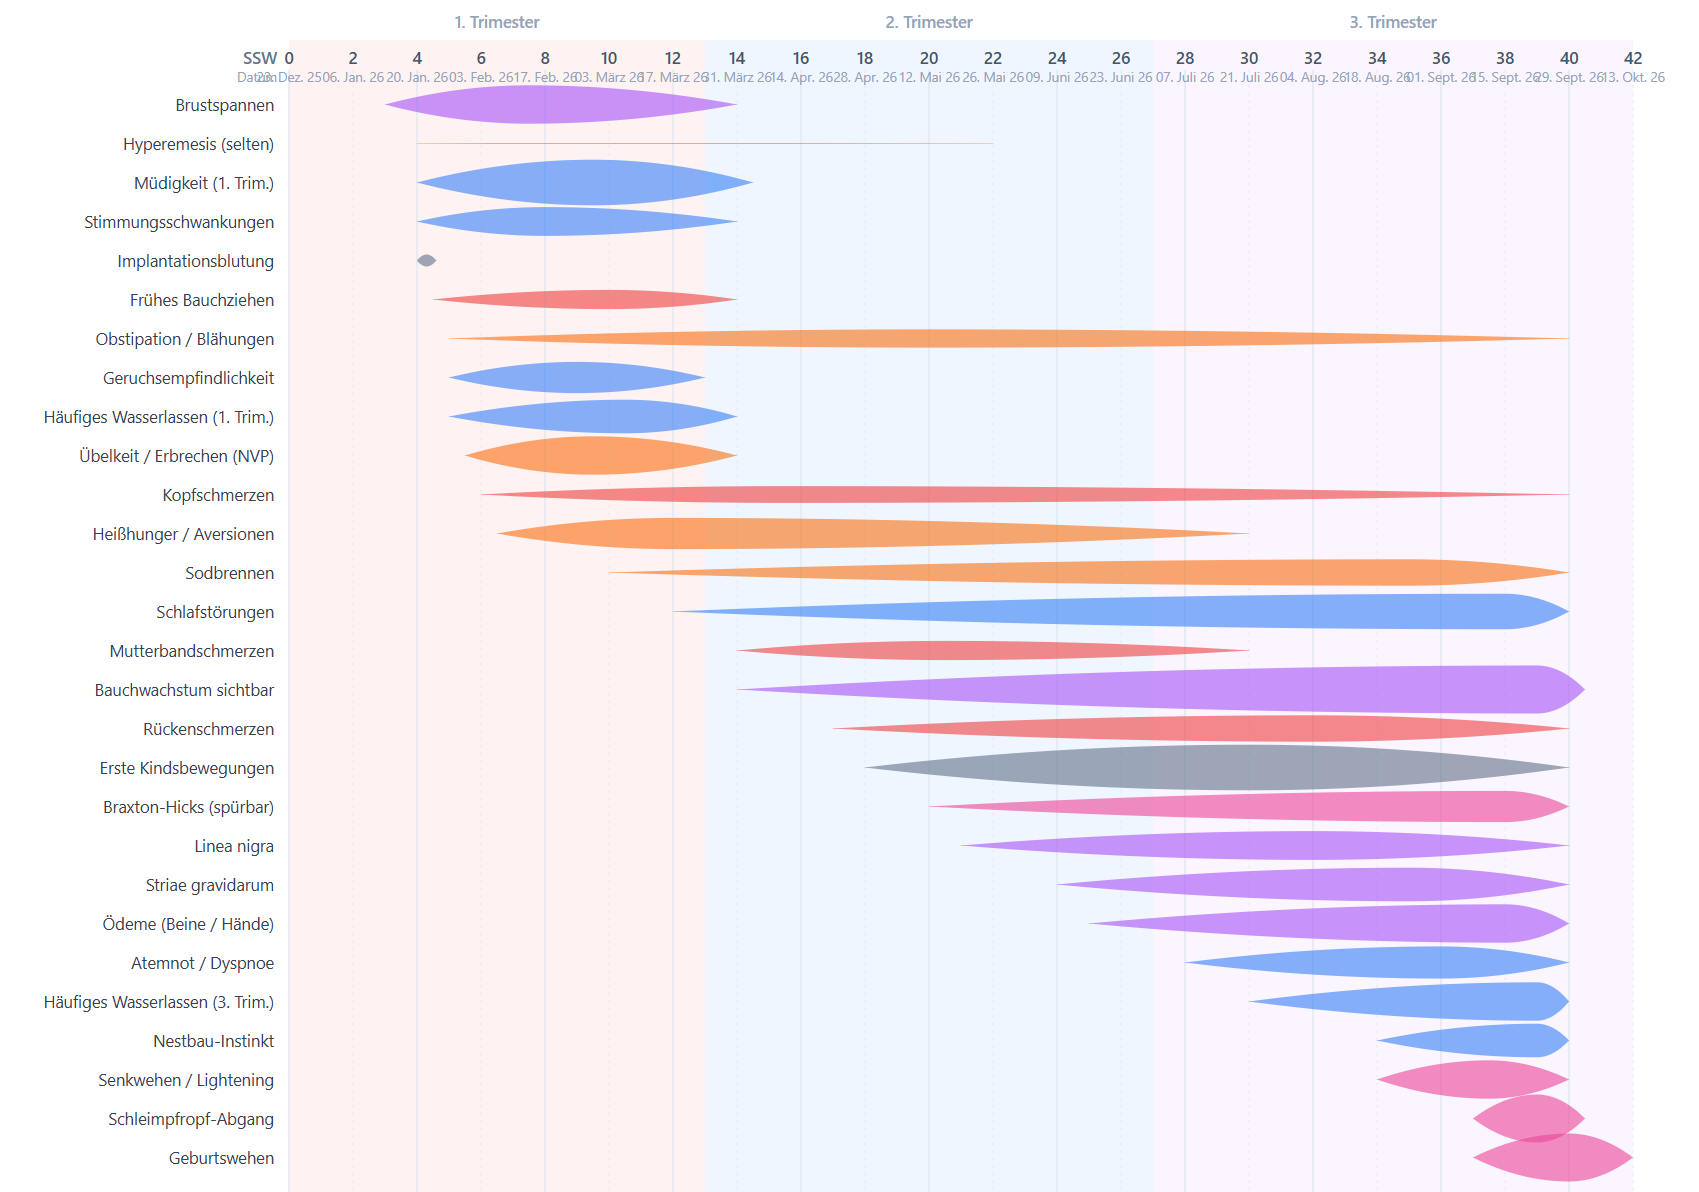
Child Development Timeline
Developmental milestones and WHO growth curves, 0–48 months
Visualizes developmental milestones across domains. Overlaid with WHO percentile growth charts for weight and height.
Open tool →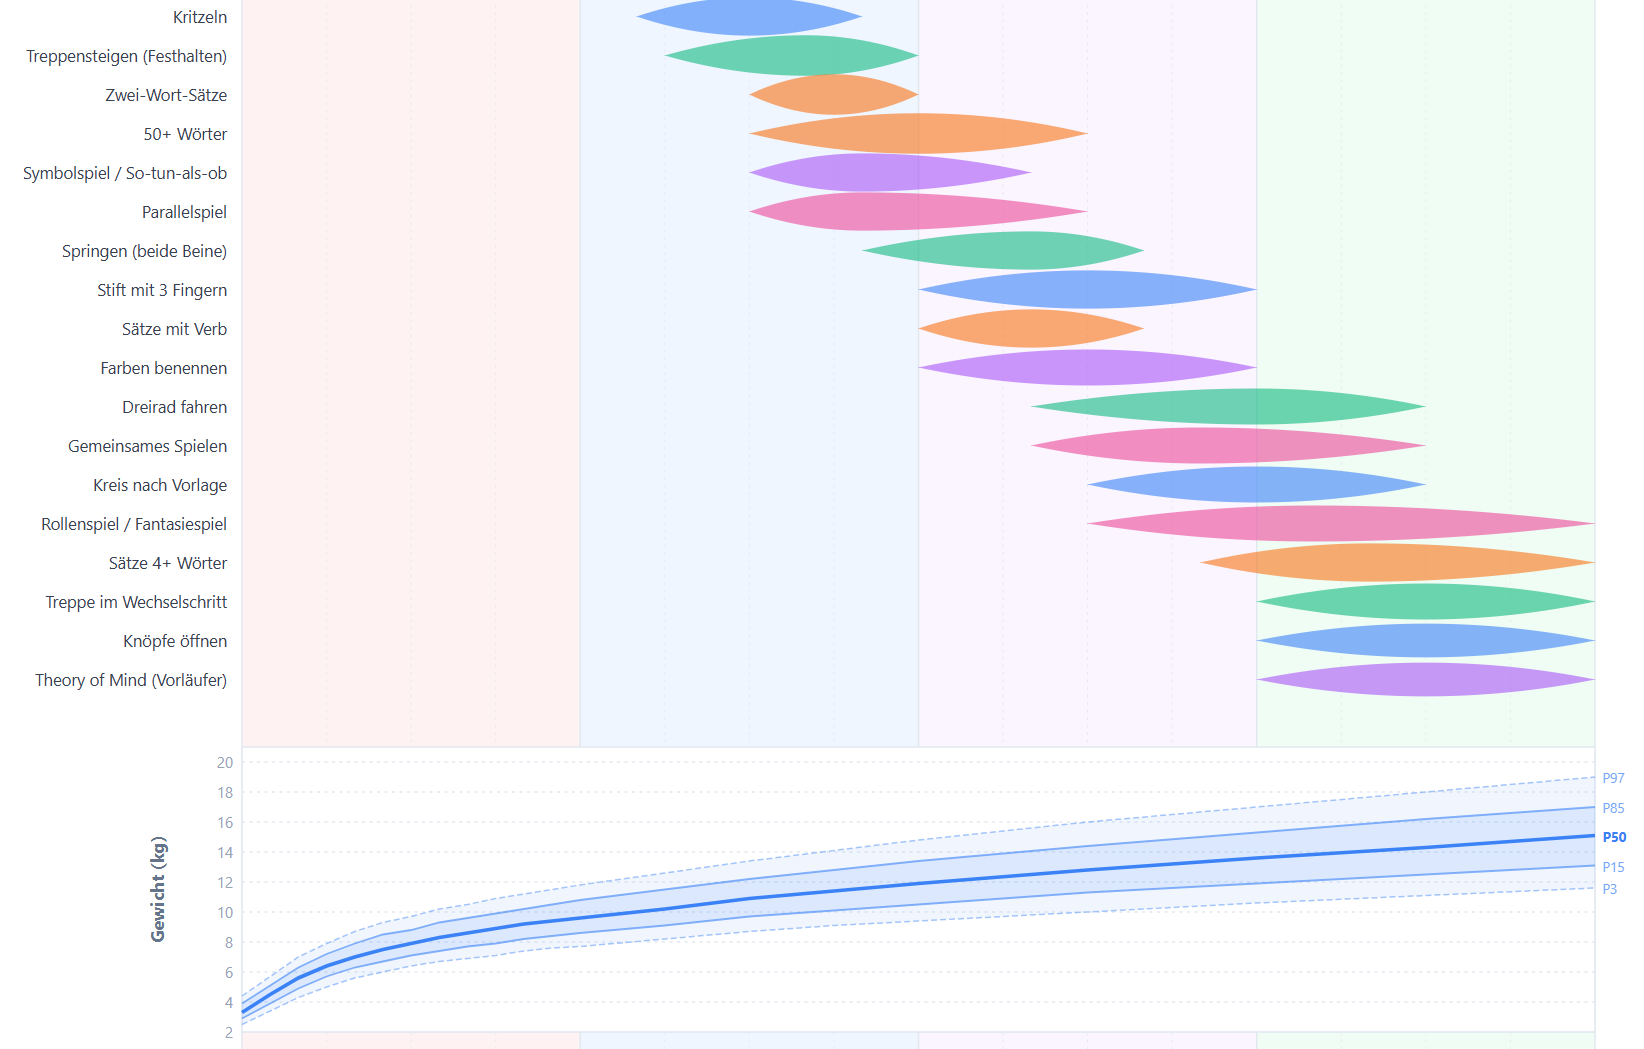
Honest Due Date Calculator
Probability distribution of the birth date, not just a point estimate
Models the birth date as a skew-normal distribution with an evidence-based expected due date, based on multiple factors.
Open tool →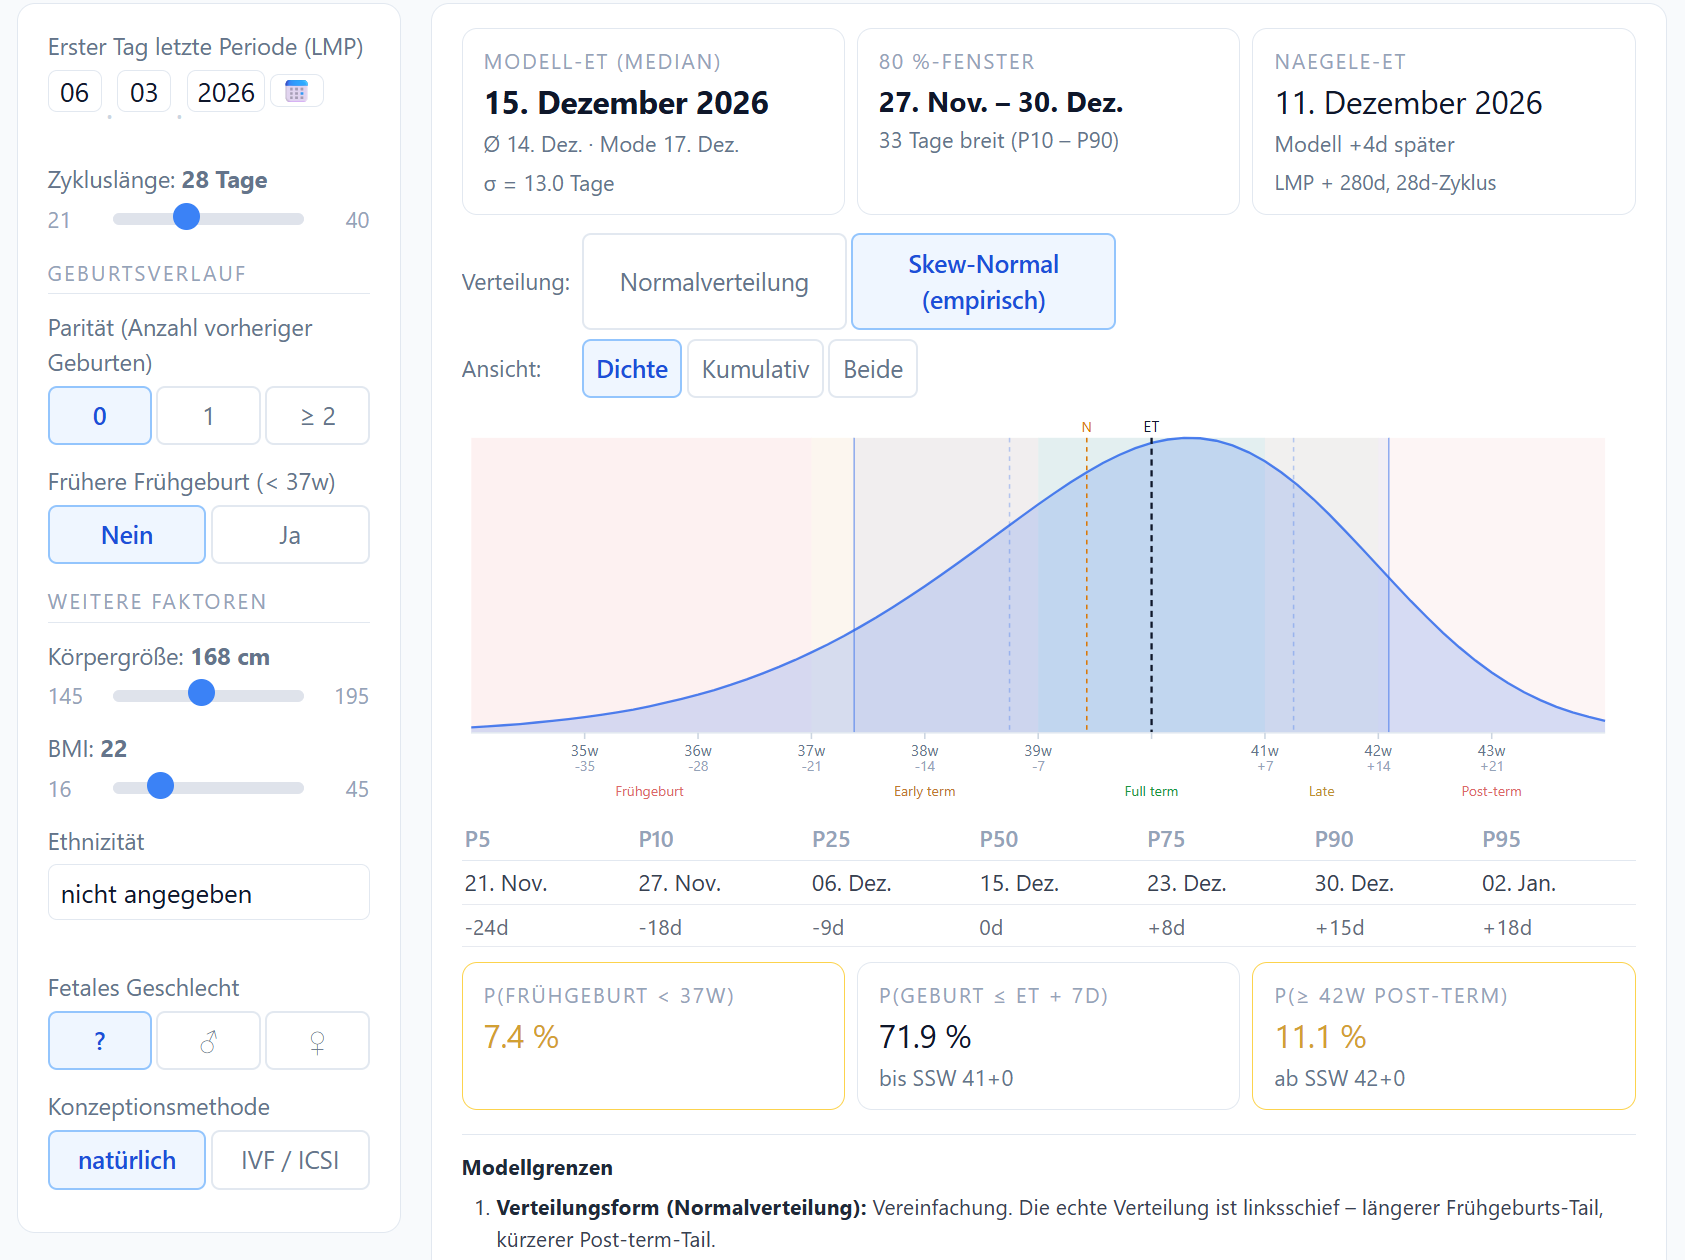
Birth Decisions Explorer
Live constraint propagation between birth choices, with evidence quality per option
Explore the choices around birth: selecting an option live-locks incompatible ones and explains why. Quantified effects, an evidence traffic-light per statement, and a generated birth-plan draft for the midwife conversation.
Open tool →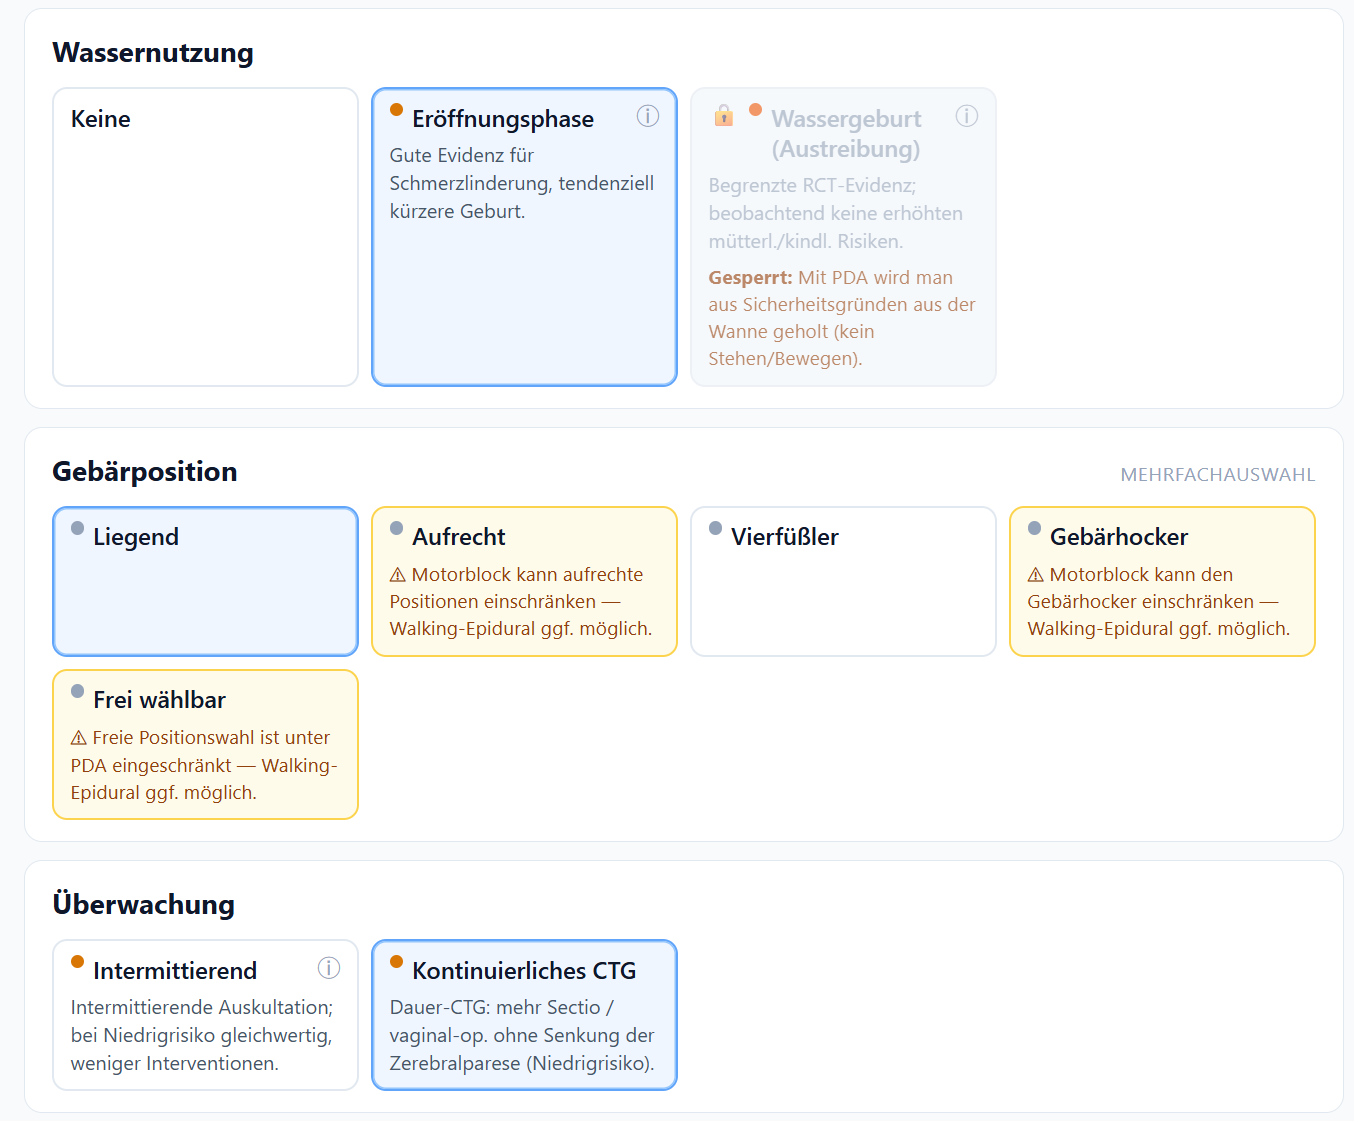
Infographic: Baby Sleep, Feeding & Crying
Distributions across the first year, 0–12 months
Total sleep and longest continuous night stretch, feeding frequency (breast vs. formula), and crying and fussing duration per day.
Open tool →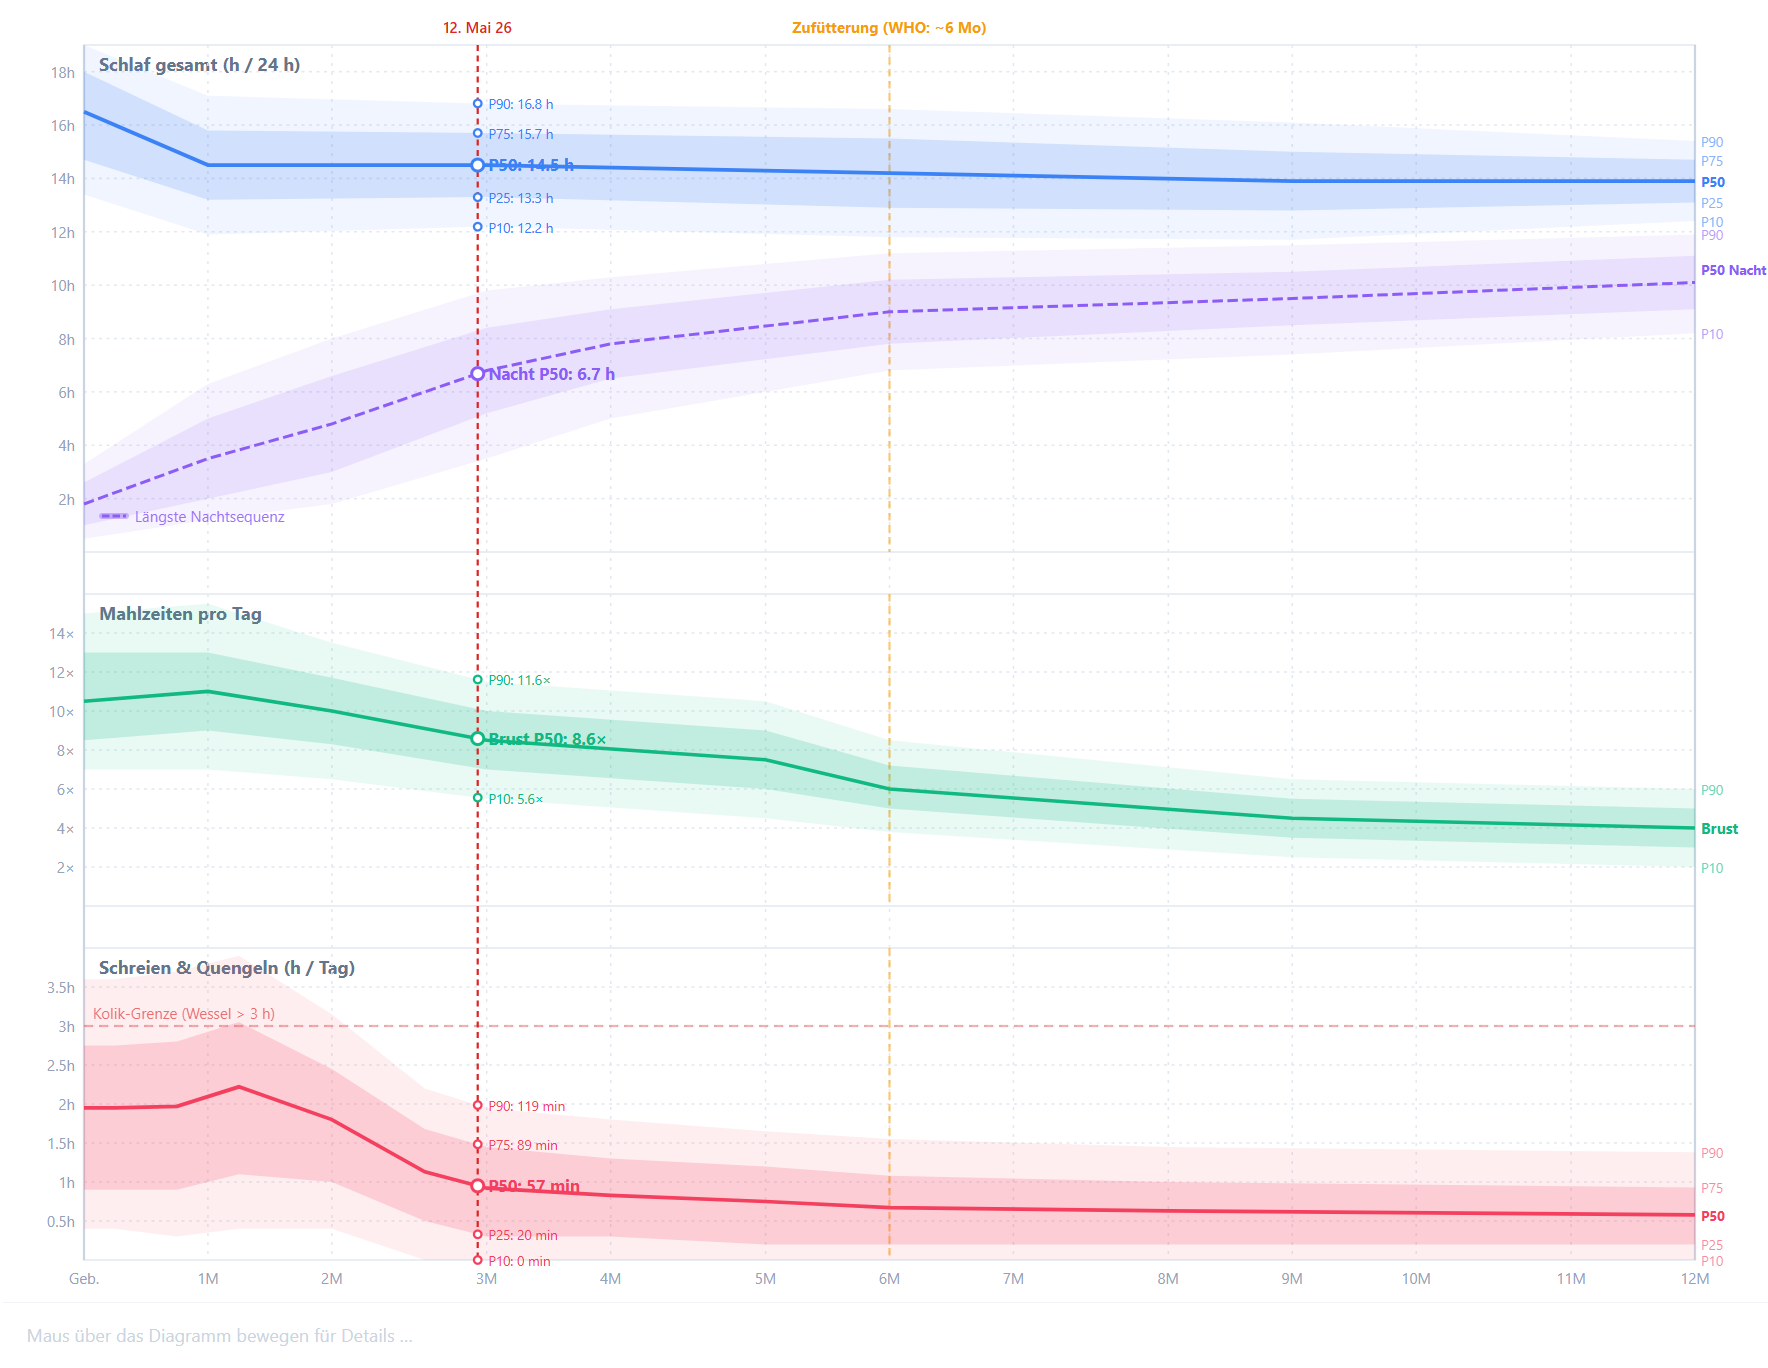
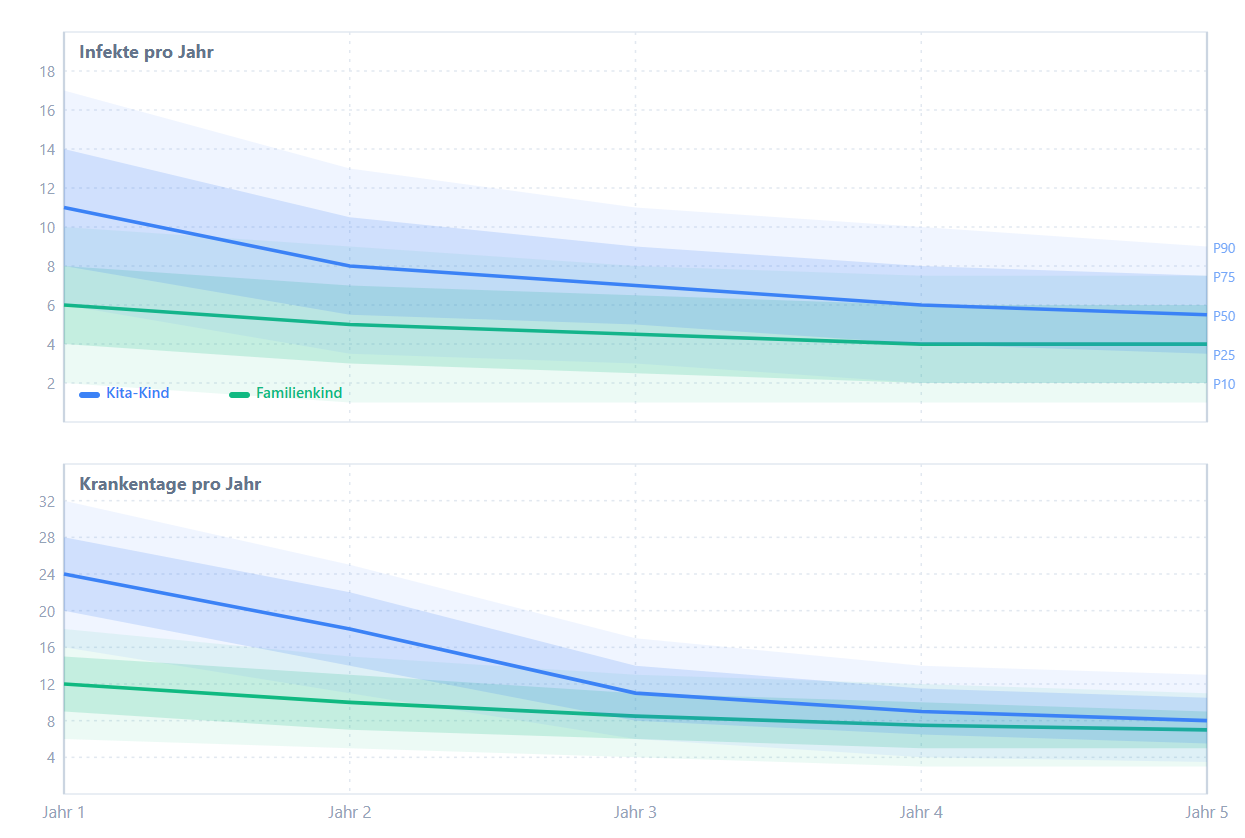
Infographic: Daycare Infections
Distribution of infections and sick days across the daycare years
Infections per year and sick days per year, shown as P10–P90 bands
Open tool →